
PROJECT OVERVIEW
An Enterprise Data Insights Suite build to deliver unified Business Intelligence insights to executives.
TEAM
4 Senior UX designers, 1 Senior researcher, 1 Power BI developer, 1 Design manager & Design Director
MY ROLE
As the UX designer at Accenture Song, I worked on everything from user research to high-fidelity prototypes, crafting intuitive, accessible AI-driven experiences while helping bring consistency through a shared design system.
DURATION
SKILLS
UX research, Wireframing, Information Architecture, Heuristic evaluations, Data Visualization, Design system, Prototyping, Usability testing
DISCLAIMER
Due to NDA restrictions, the visuals from my work at Accenture are limited & masked. Feel free to reach out for more details.
THE CHALLENGE
Understanding the MVP
Enterprise users navigating Data Marketplace MVP (an interface housing 8,000+ reports) faced overwhelming choices, inconsistent layouts and no in‑context guidance, making it difficult to locate relevant data and undermining productivity and trust in the platform.
THE SOLUTION
Our UX response
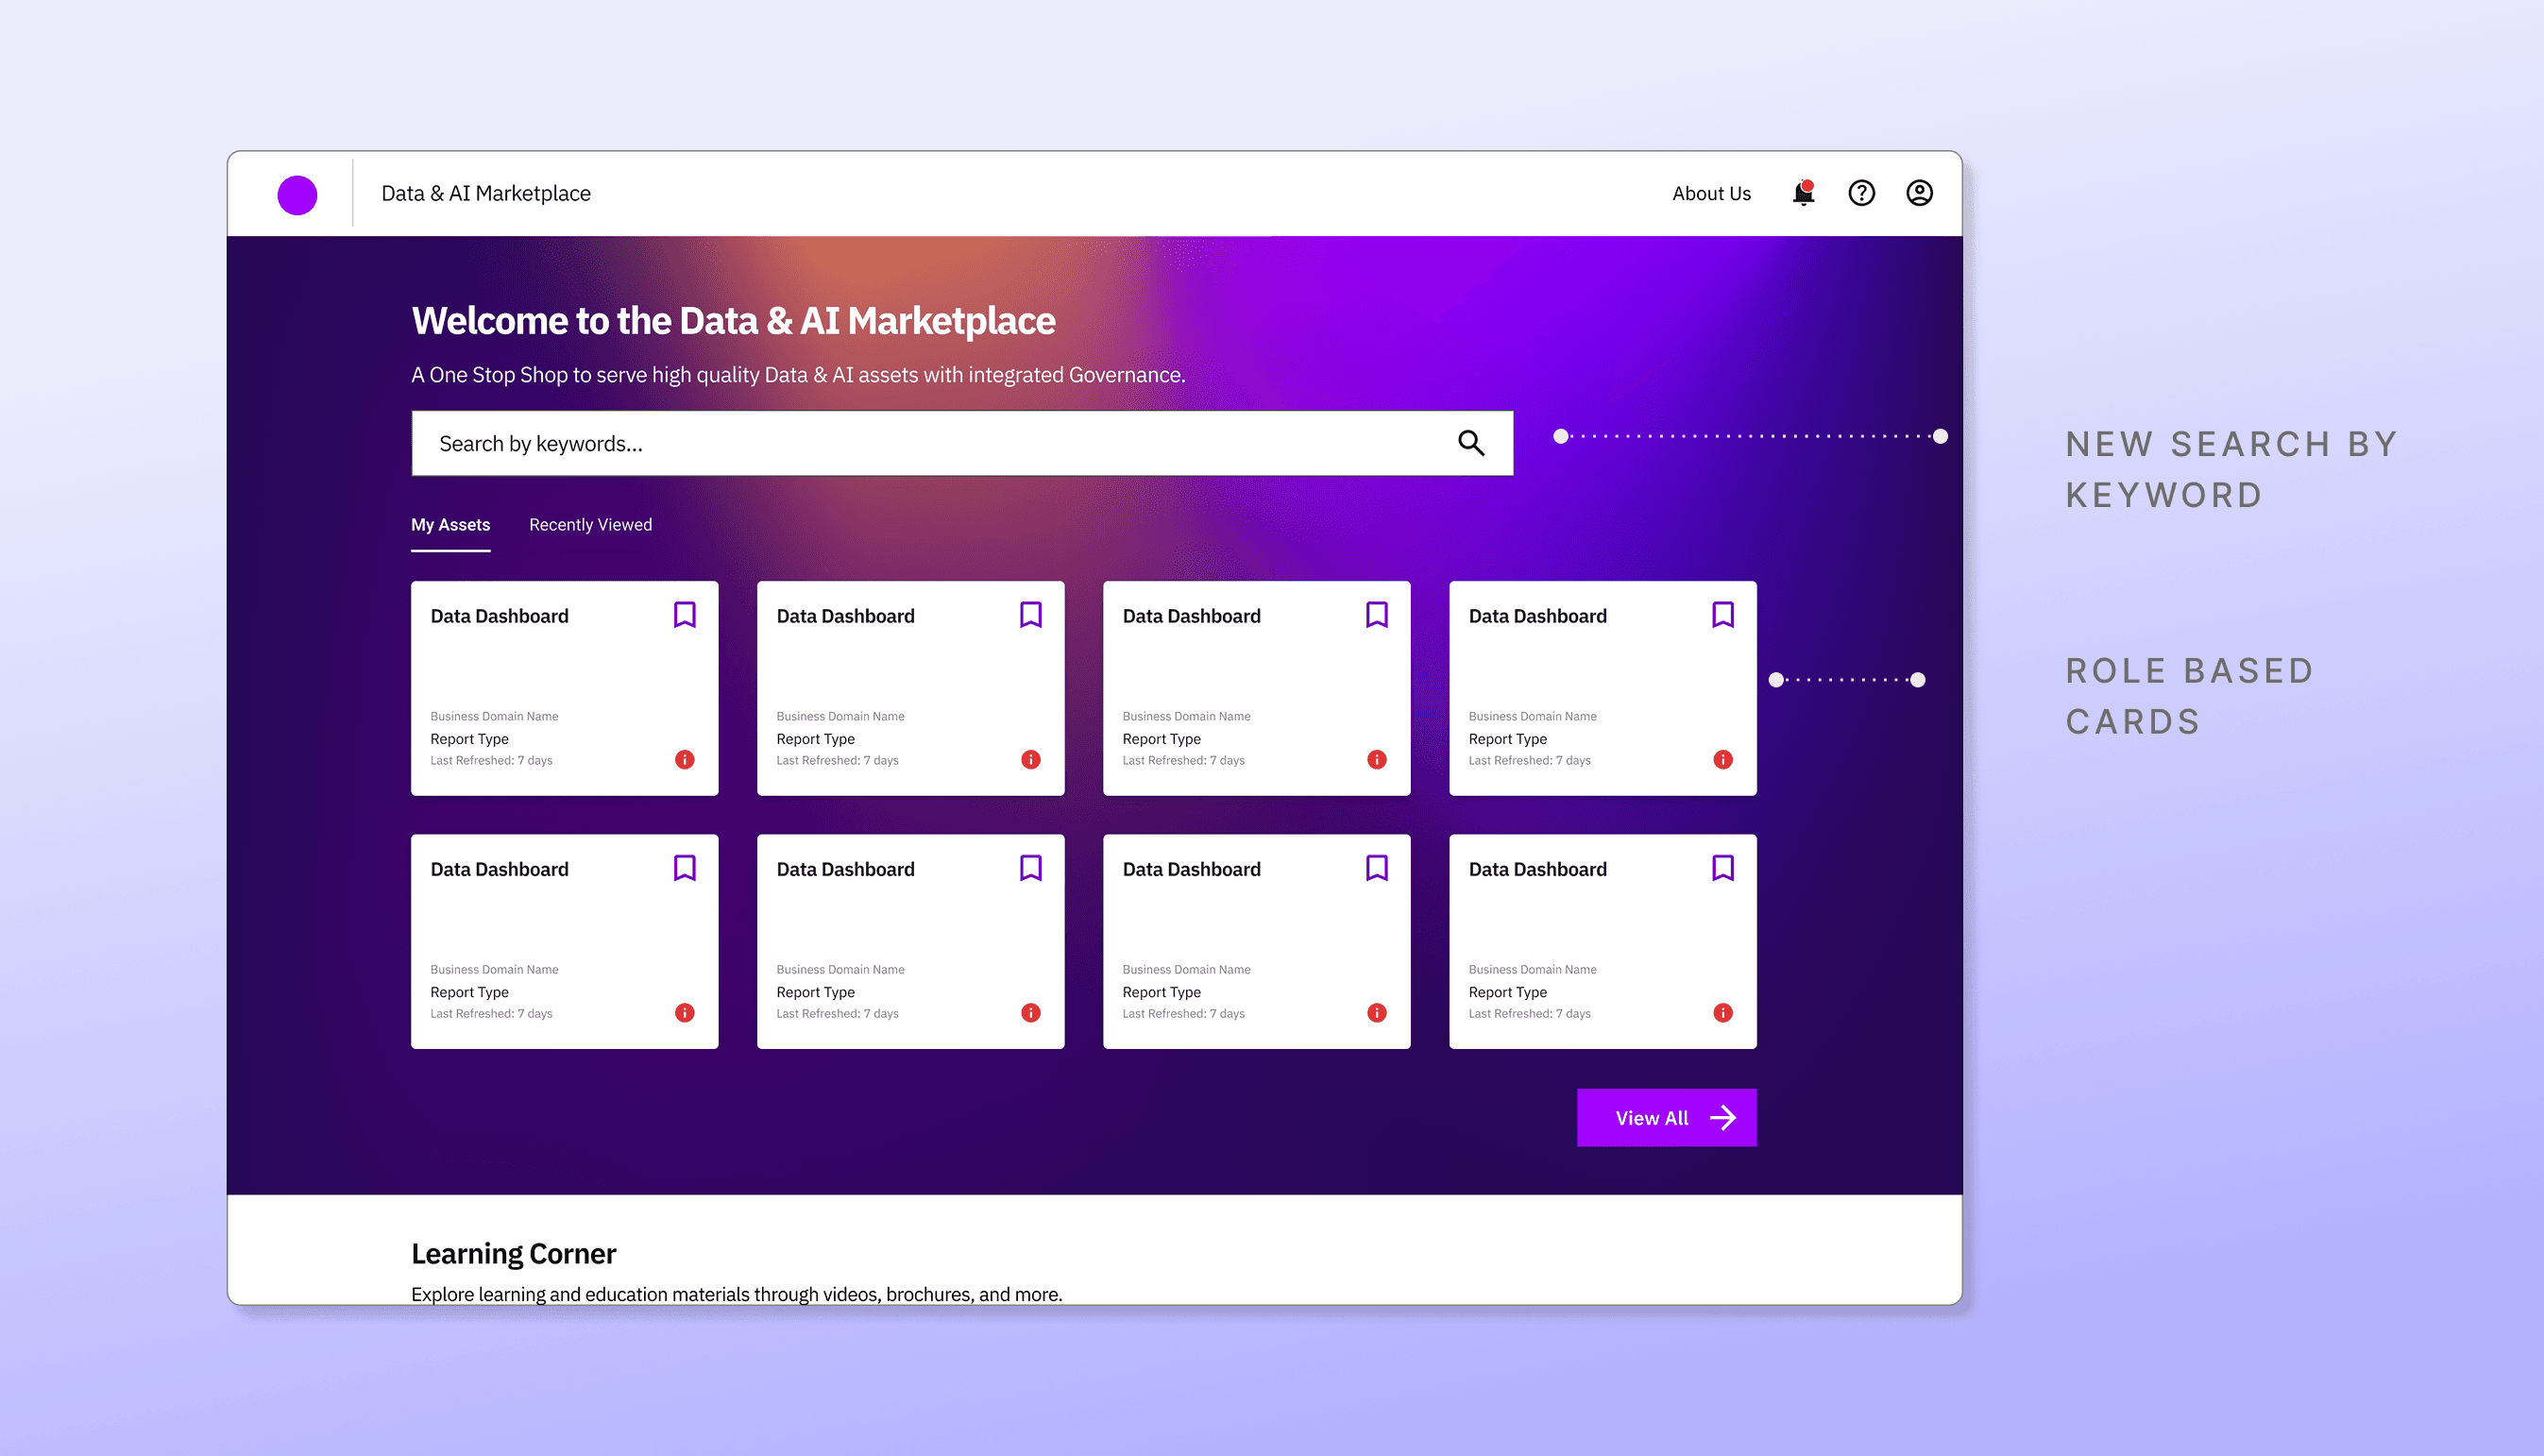
We transformed the Data Marketplace into a personalized, self-service platform using AI and a cleaner UI to help 50K+ users quickly find and act on relevant data with ease.
KEY IMPACT
faster access to data post the redesign of BI platform.
Higher CSAT scores and positive outcomes from user testing
daily users
monthly users
countries
OUR PROCESS
Heuristic audits, stakeholder calls
Defined MVP vs 2.0 feature set
Categories pages, AI chat
A/B tests, CSAT surveys
USER RESEARCH & INTERVIEWS
Understanding the users

Manages data products, ensures timely updates, and publishes clean, reliable data for use.

Ensures data quality, compliance, and access while maintaining trust in the organization’s data ecosystem.

Uses data for insights and decision-making, with access levels based on role and permissions.
TURNING INSIGHTS INTO ACTION
What drove our design decisions?

Heuristic reviews of 25+ wireframes, usability tests of 30+ users uncovered that users struggled in scanning, filtering & navigating UI.

20+ Stakeholder interviews revealed distinct needs across user types, showing that one-size-fits-all layout hindered usability.

Users repeatedly asked for quick-access tools - “I need live support when I am stuck and want to save and revisit the views that mattered.”
KEY FEATURE REDESIGN
Core Experience
FROM
WHAT LOOKS BETTER
TO
WHAT PERFORMS BETTER
Gen-AI powered personalization
THE CHALLENGE
Fragmented data visibility
Leadership lacked a single, coherent view of enterprise data health. Metrics lived in multiple systems, compliance alerts were ad hoc, and executives spent hours piecing together accessibility, reliability, and lineage information, undermining timely, data‑driven decisions.
THE SOLUTION
Our UX response
I led the end-to-end design of a Power BI Governance Dashboard that consolidates 50+ enterprise data assets into a cohesive interface that provides the leadership an at‑a‑glance, trustworthy view of data accessibility, reliability, quality and compliance.
boost in data discoverability within Q1 post-launch
increase in dashboard engagement among users
data domains monitored via a single unified interface
THE PROCESS WE FOLLOWED
Understanding the needs
Aligned with key stakeholders to audit data assets. I Identified core needs: a unified view of data health, proactive compliance alerts, and intuitive asset drill-downs, while defining success metrics as a 20% boost in discoverability and 80% SLA-based alert acknowledgment.
Sketched the high‑level IA consisting of Overview, Asset Catalog, Metric Summary and Notifications focusing on hierarchy and data grouping.
I facilitated design handoffs at the end of every sprint with annotated Figma specs and a tailored Power BI style guide, enabling seamless developer implementation and ensuring design consistency which in return accelerated the first MVP release.
We validated the experience by testing Power BI prototype with 12 stakeholders, which helped refine navigation, alert clarity, and accessibility. Whereas iteration cycles allowed us to respond to compliance changes with quarterly UI enhancements and new governance KPIs.
TURNING INSIGHTS INTO ACTION
What drove our design decisions?

Executives couldn’t trust a single source of truth, leading to duplicated effort.

Poorly structured categories made discovery slow and error-prone.

Teams only discovered compliance issues reactively, delaying remediation.
KEY PRODUCT HIGHLIGHTS
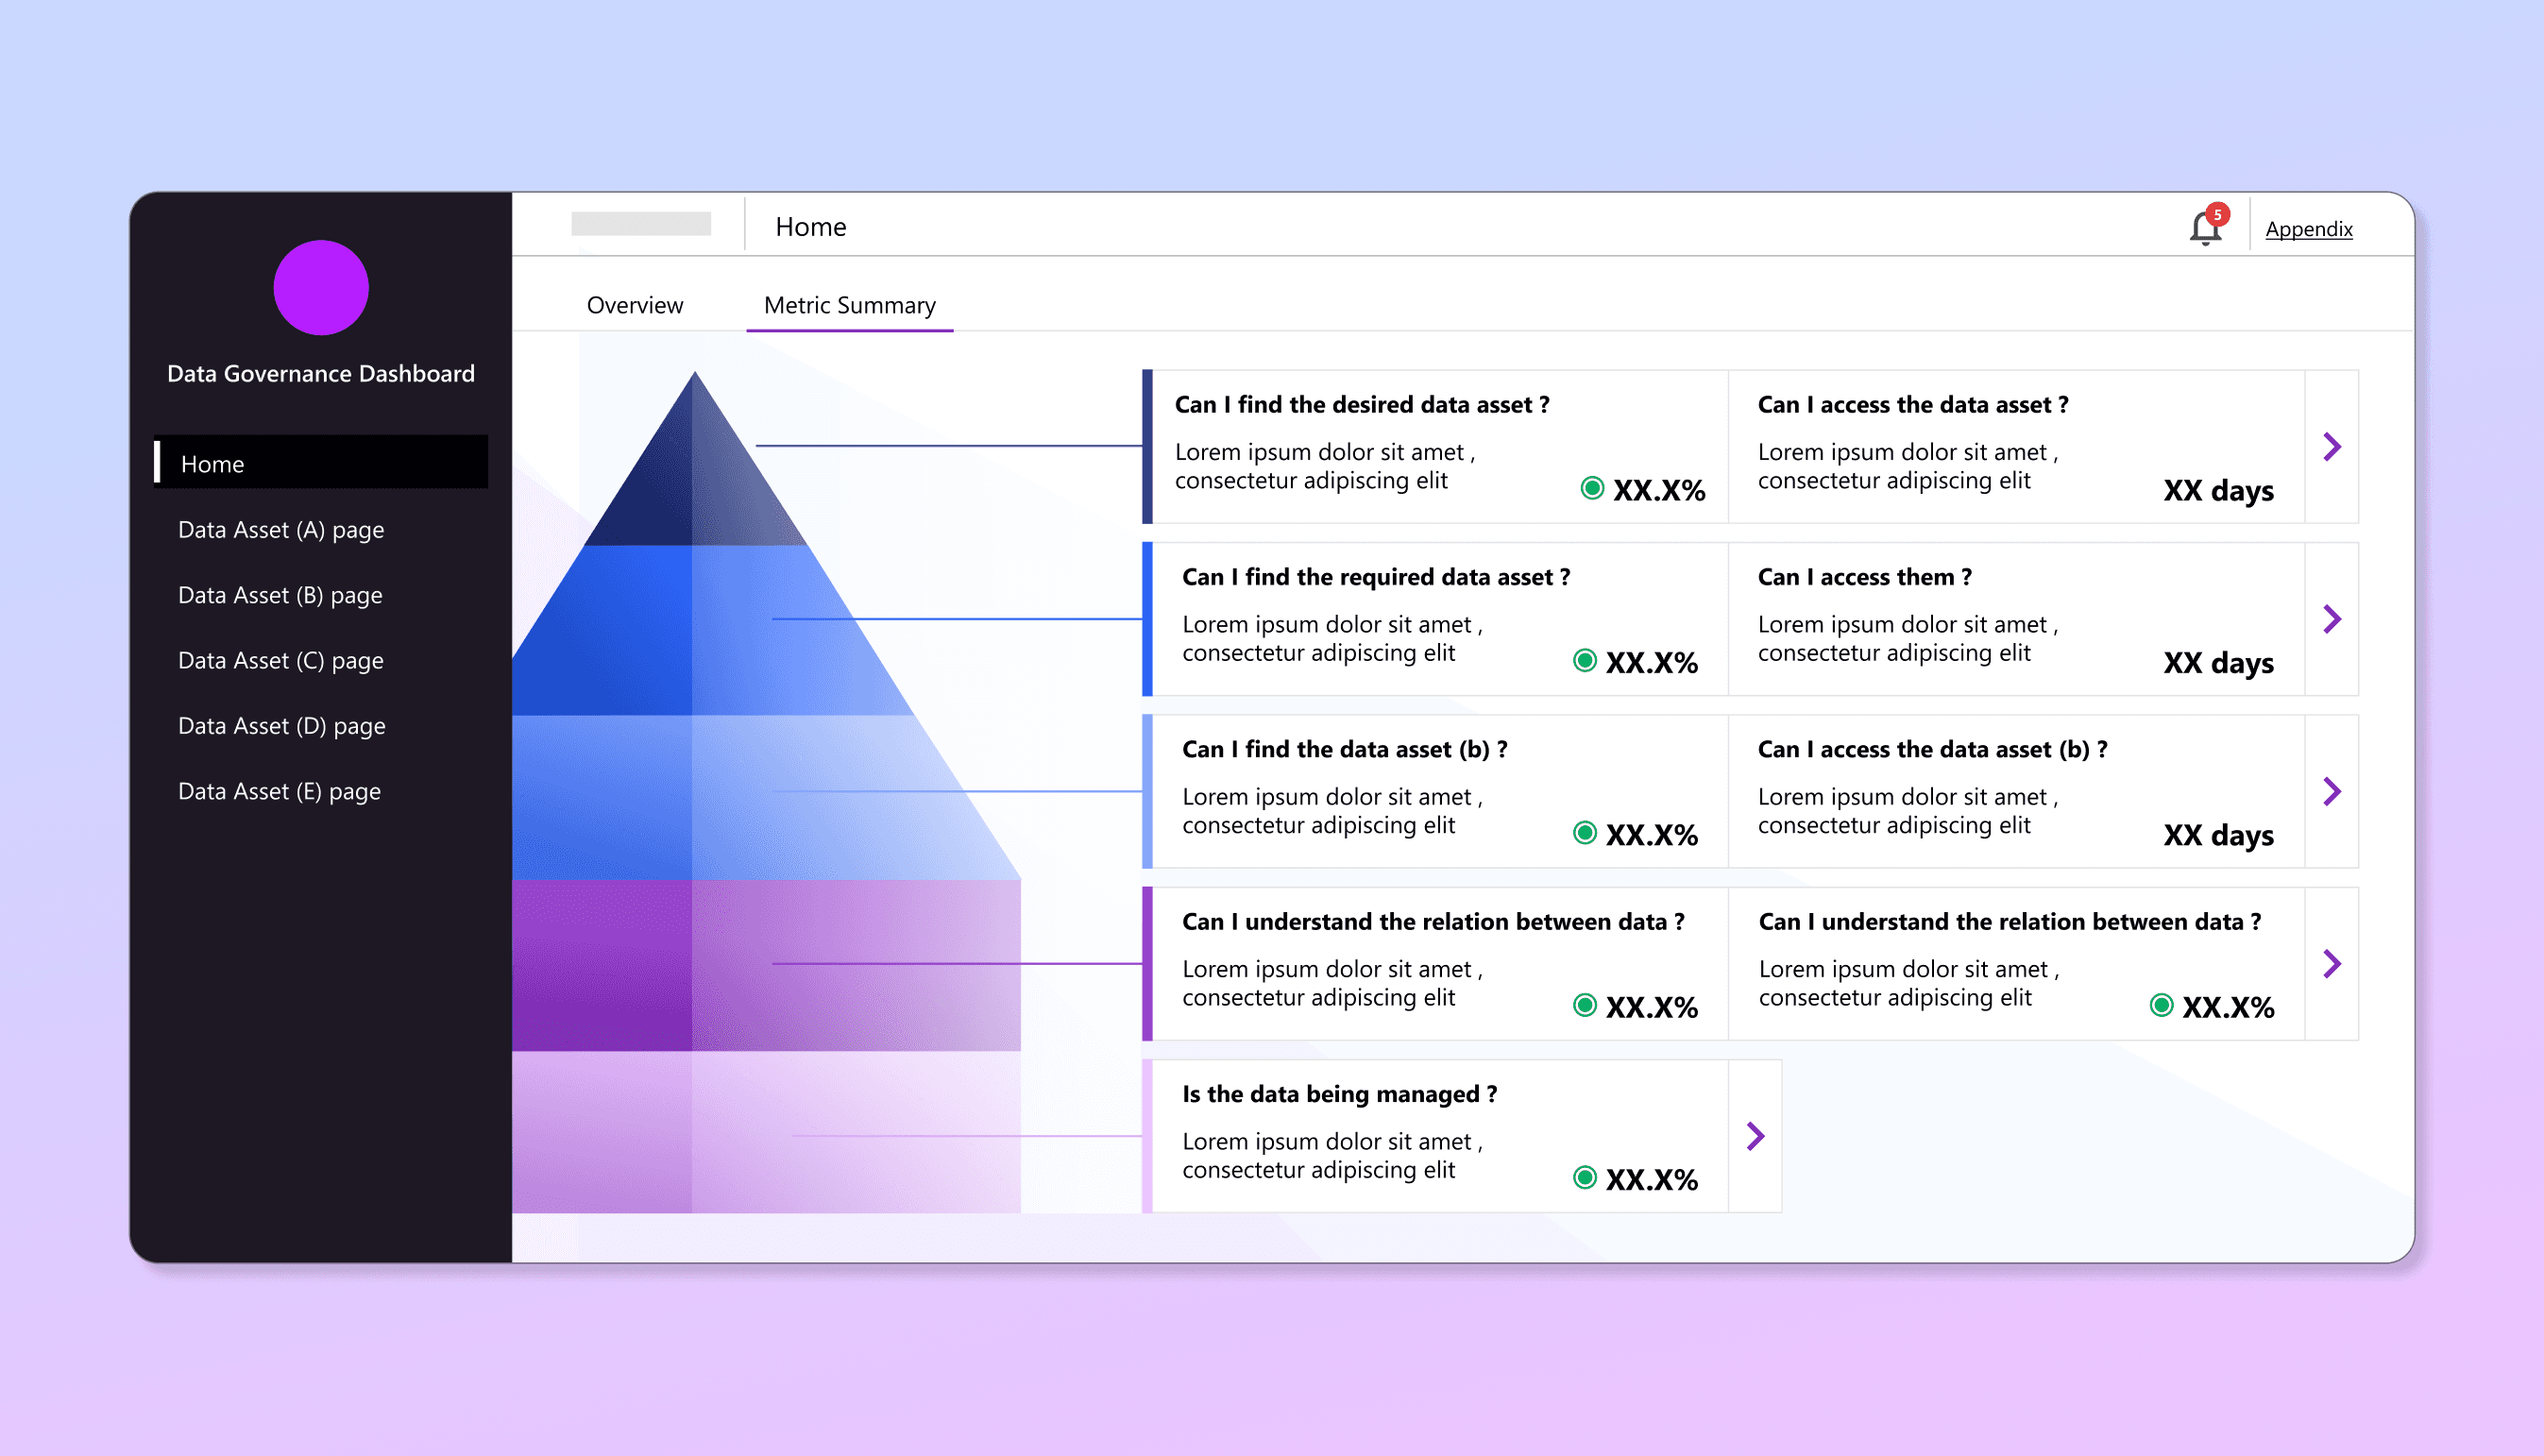
Overview and metric summary page
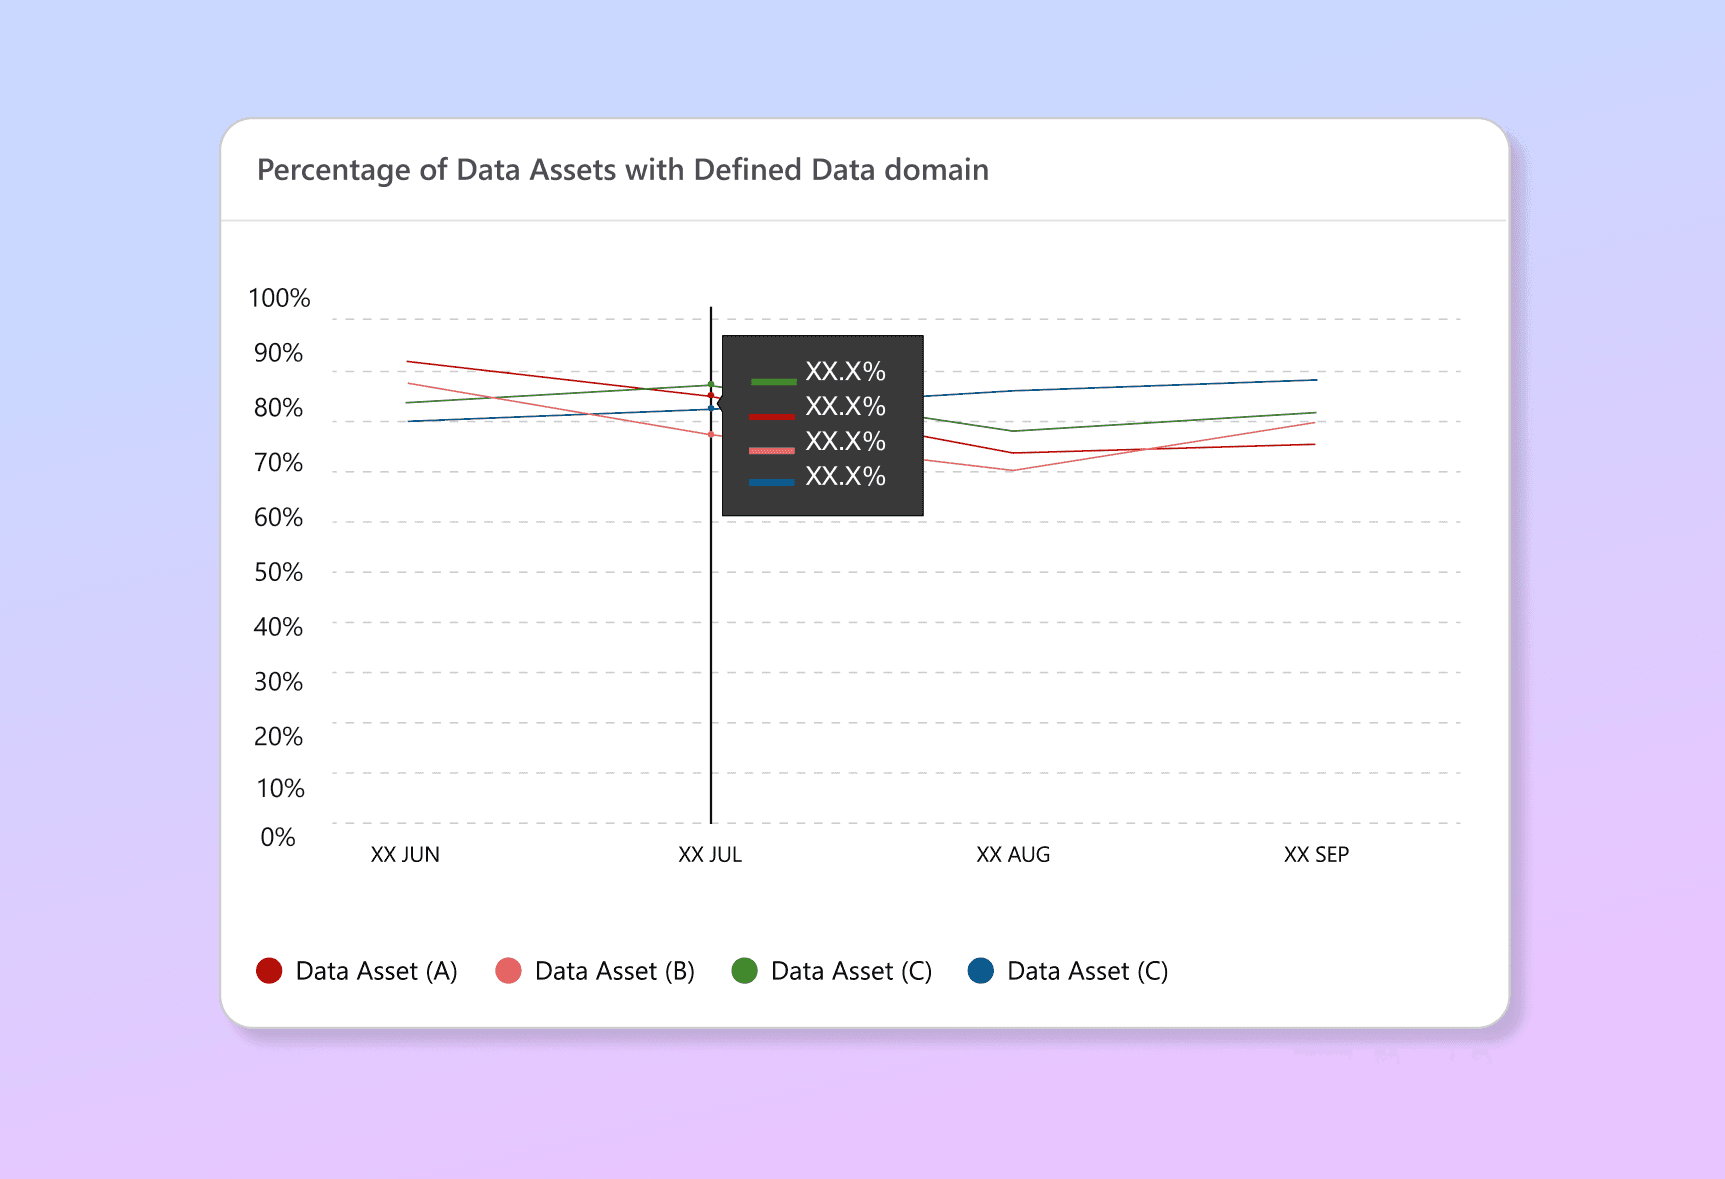
High‑level scorecards and trend charts for immediate status checks with dedicated layouts for Data assets
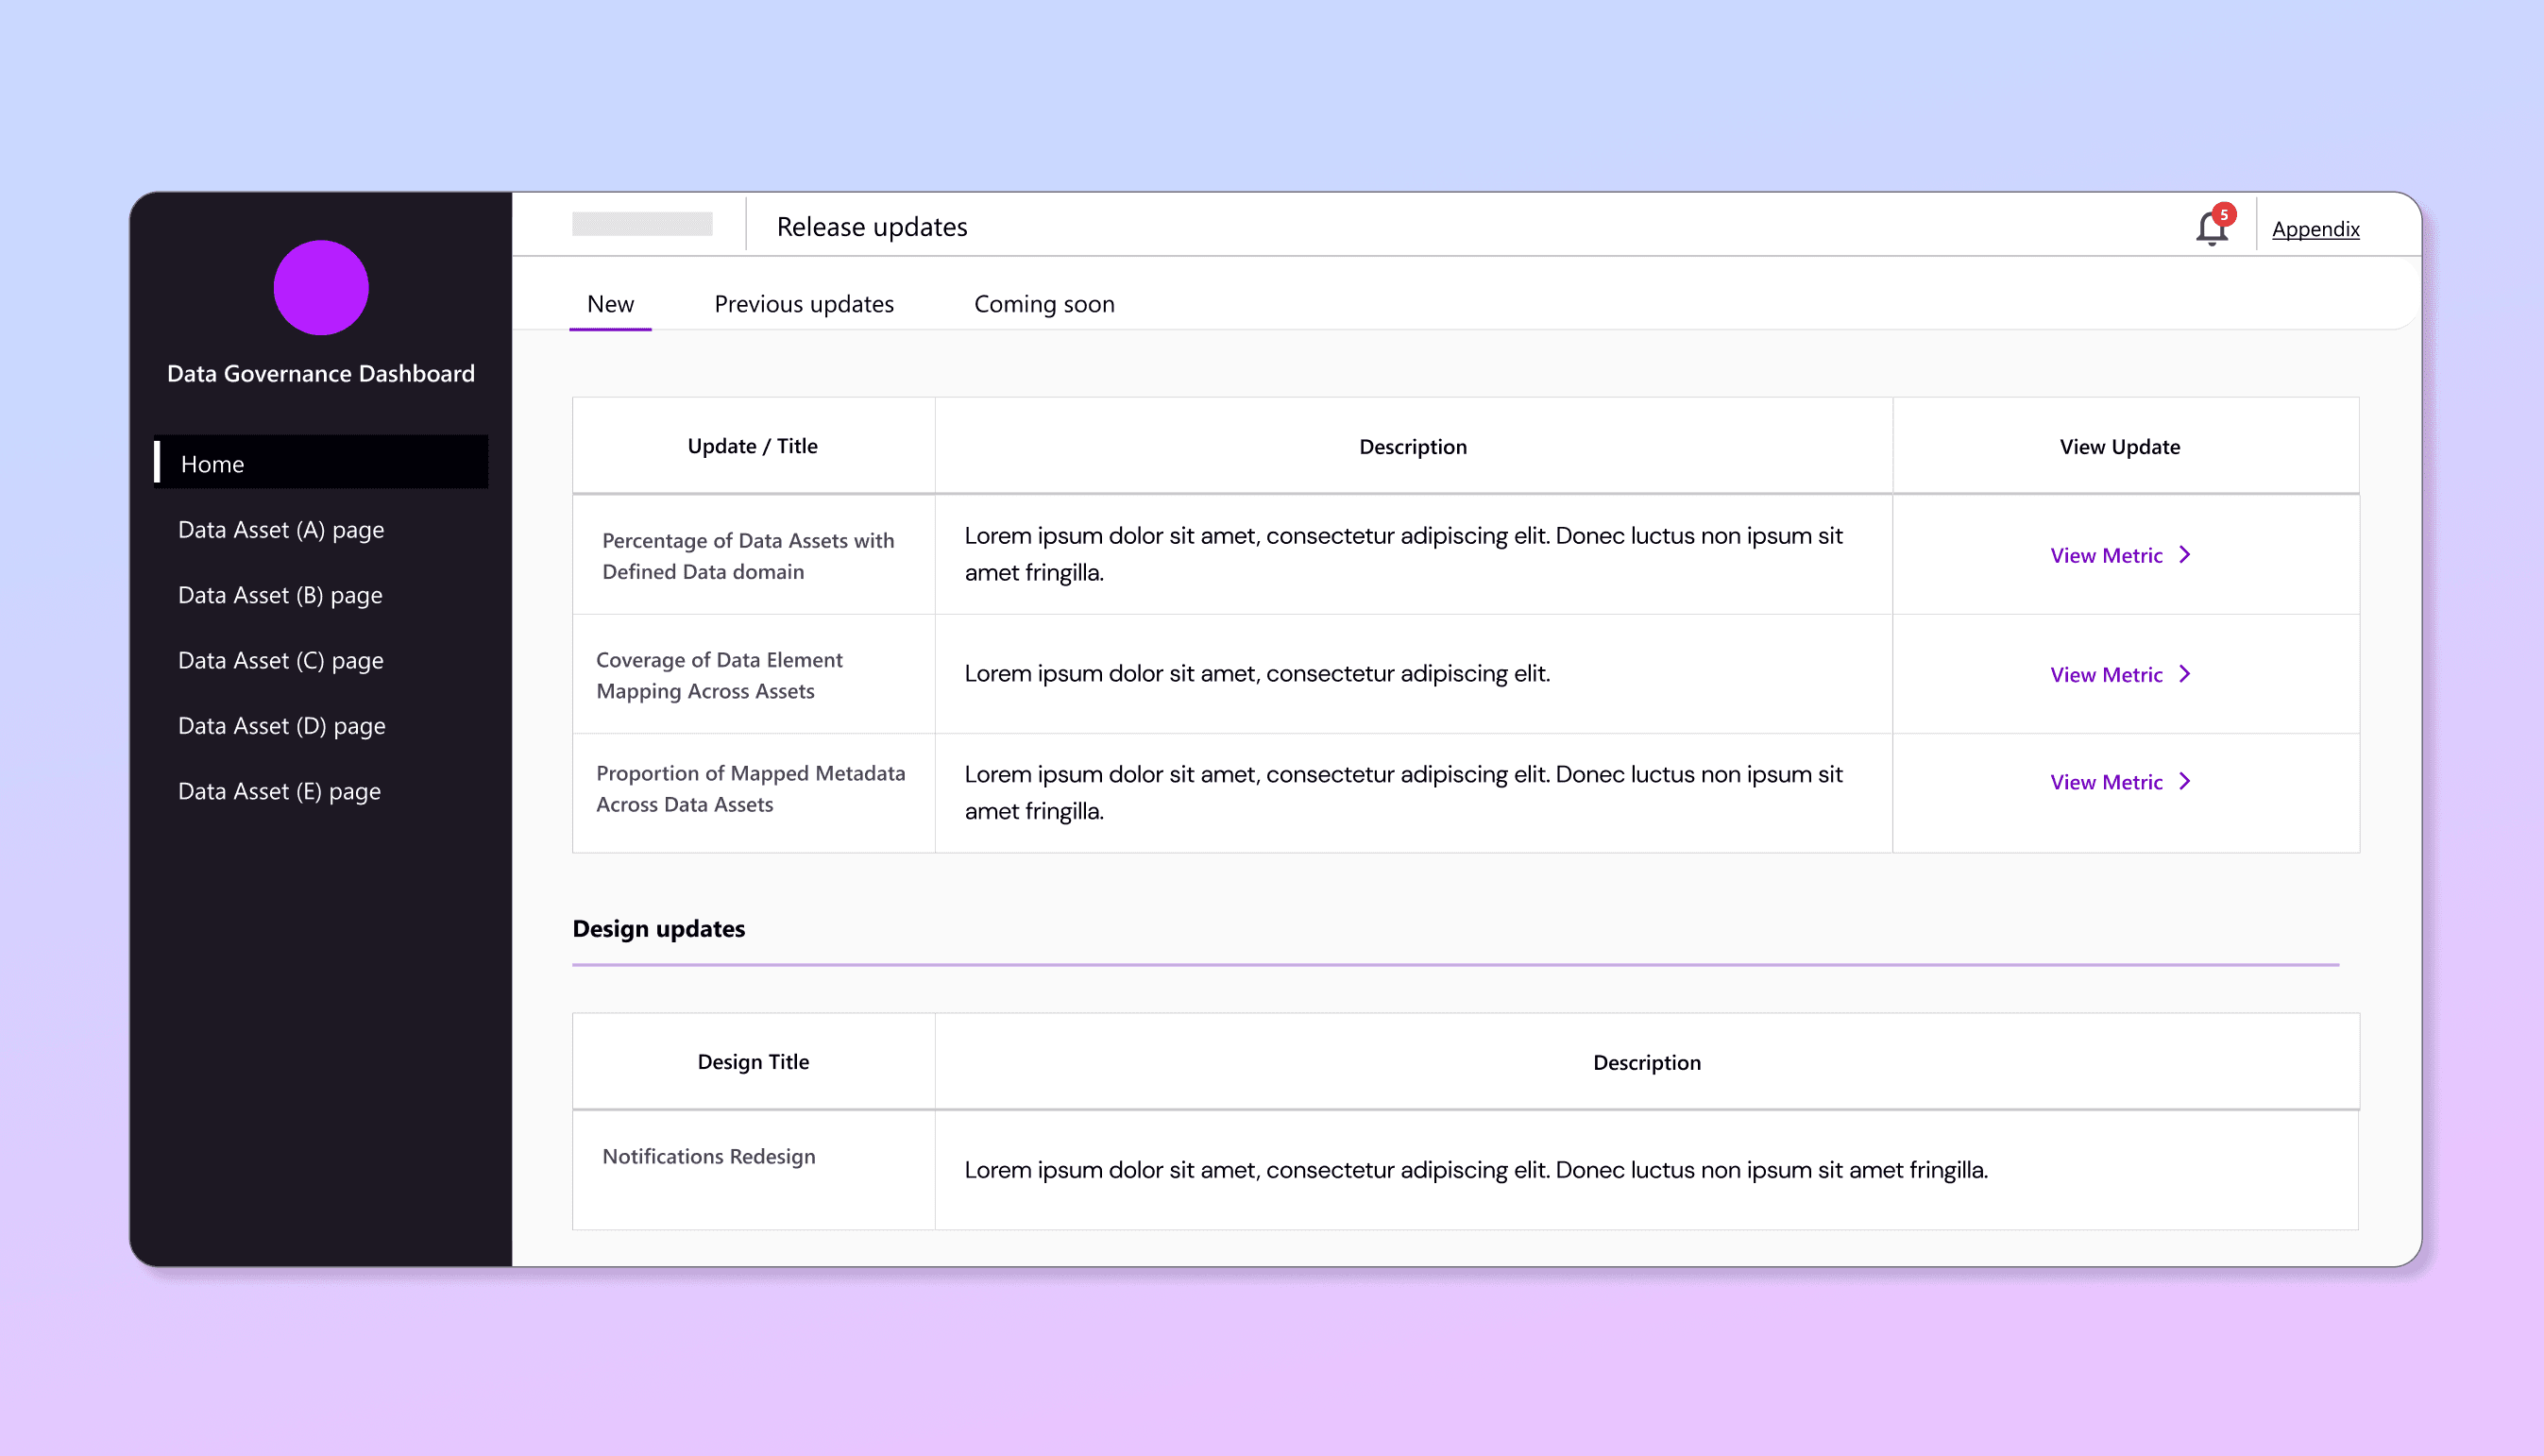
Real-time notifications
Alert feed for governance exceptions (e.g. missing lineage, stale assets, design updates).
Design System alignment
Reusable cards, tables, and nav components sized for Power BI constraints, ensuring consistency and faster iteration.
Building a Cohesive Design system
Why it was needed?
Teams across the Data & AI studio were using inconsistent design systems, leading to fragmented UI, accessibility issues and inefficient handoffs. An audit revealed problems like misaligned padding, color mismatches and complex variants. I co-contributed in building and maintaining a Design System Playbook while ensuring accessibility and consistency across different products.
Components included Colors, typography, icons, accordians, buttons, filters, cards, tables, alerts, KPI’s, navigation, charts.
My key learnings & takeaways
Building on a new product with an agile setup taught me to embrace uncertainty, stay focused on what matters, and move fast with feedback & clarity with every MVP iteration.
Working with complex enterprise data taught me that less is more. Removing the unnecessary, consolidating the redundant & focusing only what truly matters.
I learned to communicate complex data & UX into intuitive stories, aligning with devs while guiding stakeholders through the 'why' to ensure solutions were both usable and scalable.